Most pallet operations have production data. Few use it effectively. The difference between operations that improve year-over-year and those that plateau is almost always how they use shift-level performance data.
Why Shift Data Matters
Aggregate numbers hide problems. When you look at daily or weekly totals, everything averages out. A great morning shift masks a struggling evening shift. A fast Monday covers for a slow Friday.
Shift-level data reveals patterns that totals cannot:
- Which shifts consistently outperform?
- Where do slowdowns happen during the day?
- Are certain product mixes causing bottlenecks on specific shifts?
- Is performance declining over time on any line?
Three Ways to Use Shift Data
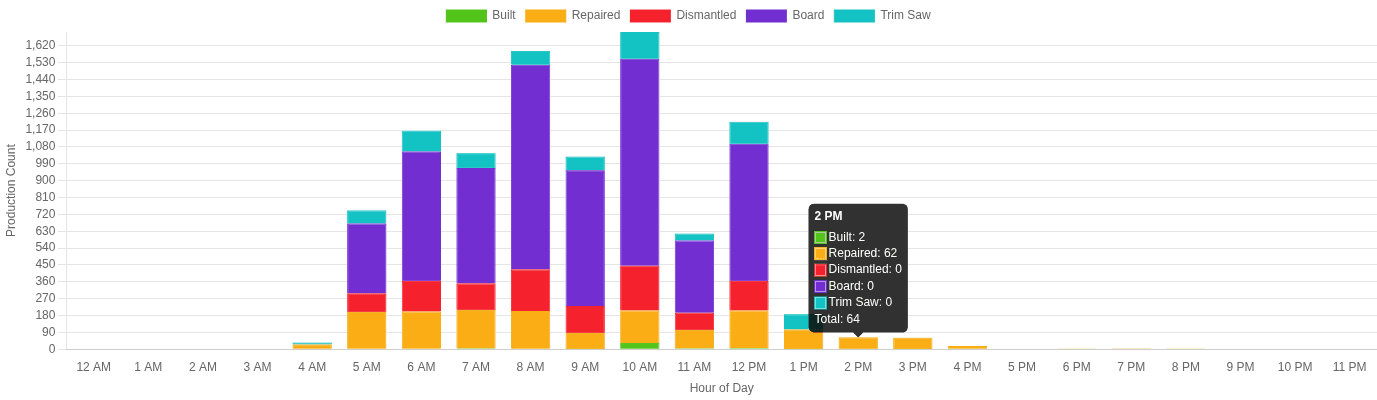
1. Identify Your Best and Worst Hours
Use hourly production breakdowns to find the peaks and valleys in each shift. Common patterns include:
- Post-break dip: Production drops 15-20% in the hour after breaks as workers ramp back up
- End-of-shift fade: The last hour of a shift often produces 10-15% less than mid-shift hours
- Shift handoff gap: The 30-60 minutes around shift changes often have the lowest output
Once you see these patterns, you can address them. Stagger breaks. Overlap shift handoffs by 15 minutes. Set mini-targets for the last hour.
2. Compare Shifts on the Same Lines
The most valuable comparison is the same line across different shifts. This controls for equipment, product mix, and layout — isolating the human factor.
If Shift A consistently produces 12% more on Line 3 than Shift B, the question is why. Common reasons:
- Different levels of experience
- Different approaches to staging materials
- Different break patterns
- Equipment issues that only affect one shift (e.g., machines running hot in the afternoon)
3. Set Data-Driven Targets
Replace gut-feel targets with data-driven ones. Use your best shift's average output (not peak) as the target for all shifts. This is achievable because someone is already doing it.
Then track progress weekly:
- What percentage of shifts hit target?
- Is the gap between best and worst shifts narrowing?
- Are targets being adjusted as the team improves?
Making It Practical
The biggest barrier to using shift data is not having it in time. If counts arrive 4 hours after the shift ends, the moment for action has passed.
Real-time production data changes the dynamic:
- Supervisors see current output during the shift and can intervene
- Workers check the dashboard themselves and self-correct
- End-of-shift reviews happen with complete, accurate data
What Good Looks Like
Operations that use shift data effectively typically see:
- 5-15% production increase within 3-6 months from better scheduling and target setting
- Reduced variance between shifts — the gap between best and worst shifts narrows
- Faster problem identification — bottlenecks spotted in hours instead of weeks
- Improved team engagement — workers respond to visible, fair, shared data